

Open-source EEG analysis & brain mapping
Free, open-source EEG analysis in the browser — from a research-grade de-noising pipeline to brain maps, sLORETA source imaging, LZC complexity and peak alpha.
How it works
From raw recording to brain map in three steps
01
Upload EEG
Drop in an EDF, BDF or CSV recording with eyes-open and eyes-closed segments, then scroll it in the viewer and mark artifacts by hand if you want to.
02
De-noise
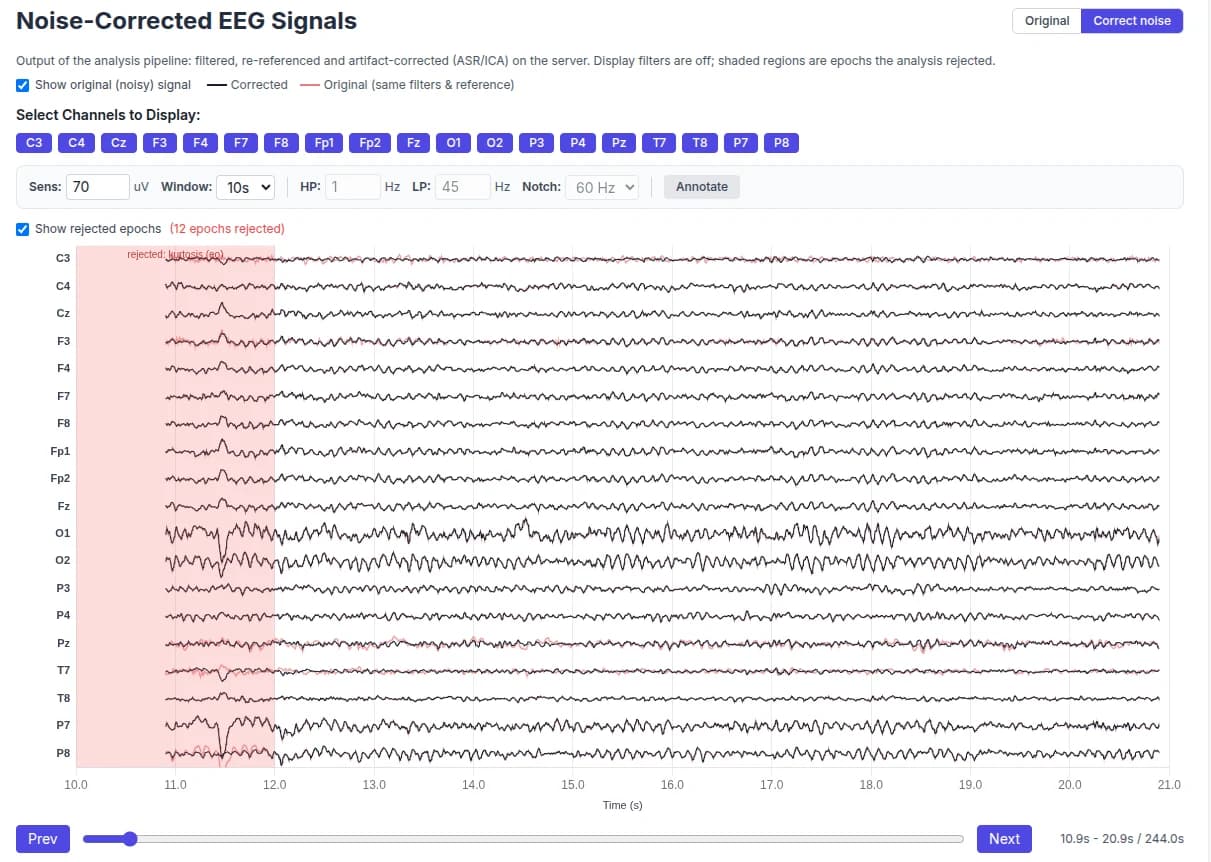
An automatic cleaning pipeline removes mains hum, repairs bad channels and transients, and strips blinks and muscle with ASR and ICA. Flip Raw / Cleaned to see exactly what changed.
03
Analyze & map
Get brain maps, sLORETA source images, complexity, peak alpha, connectivity and asymmetry — rendered live in the browser and exportable as JSON or a cleaned file.
Signal de-noising
See exactly what the cleaning did
Every analysis runs a research-grade artifact pipeline on the server. Overlay the original signal in red on the corrected one in black, and see the epochs it rejected shaded on the timeline — each one labelled with the reason.
- Mains notch
- Channel QC
- Zero-phase filter
- Transient repair
- ASR
- ICA
- Epoch rejection
Choose a full, conservative, aggressive or rejection-only profile — or exclude segments you marked by hand.
Source localization
sLORETA: from the scalp into the brain
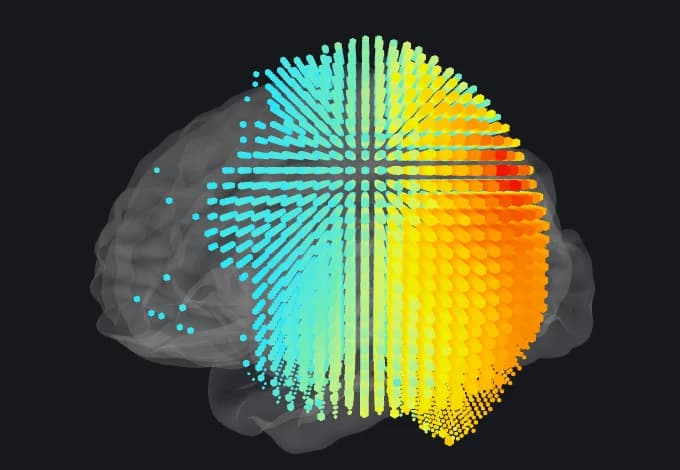
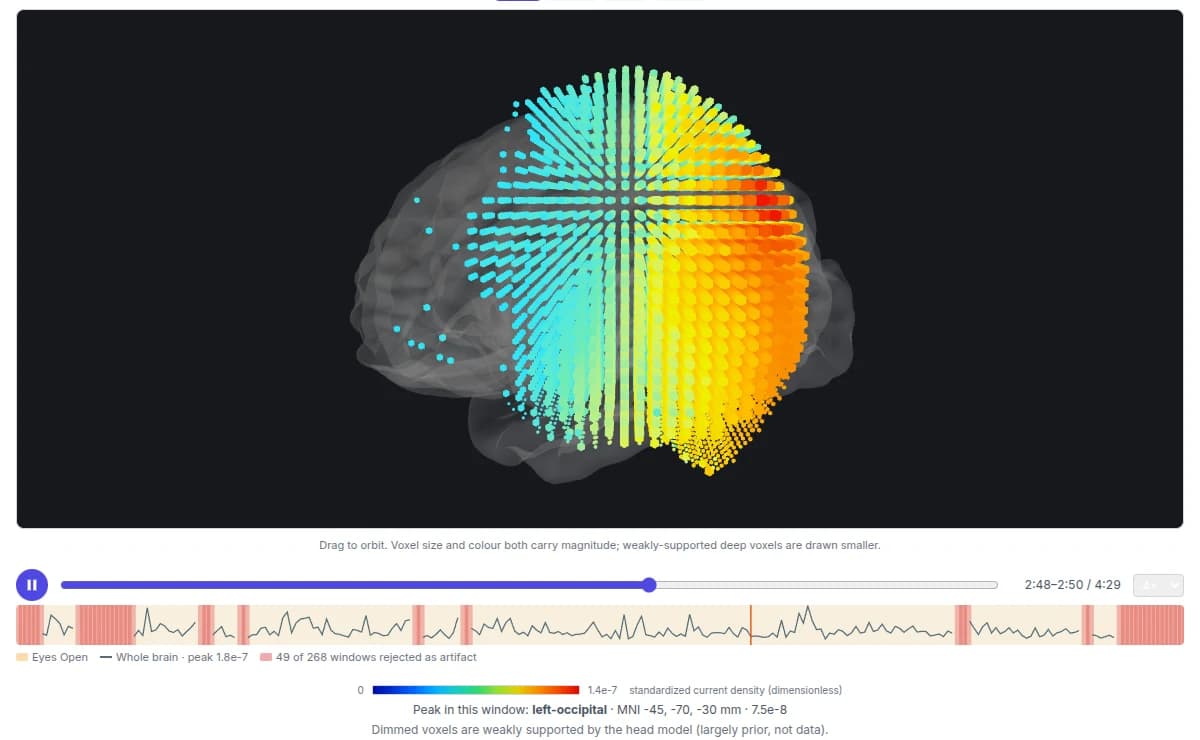
Squiggly estimates where activity comes from, not just where it lands on the scalp. Standardized current density for every band, on MNI slices or as a 3D voxel cloud — played as a time lapse across the whole cleaned recording.
Networks
Seed regions for default mode, salience, central executive, dorsal attention, sensorimotor and visual networks.
Time lapse
Every 2 s window of the recording, with rejected windows marked on the transport.
Peak finder
The strongest region in each window, named and placed in MNI coordinates.
Quantitative EEG
Brain maps, connectivity and peak alpha — side by side
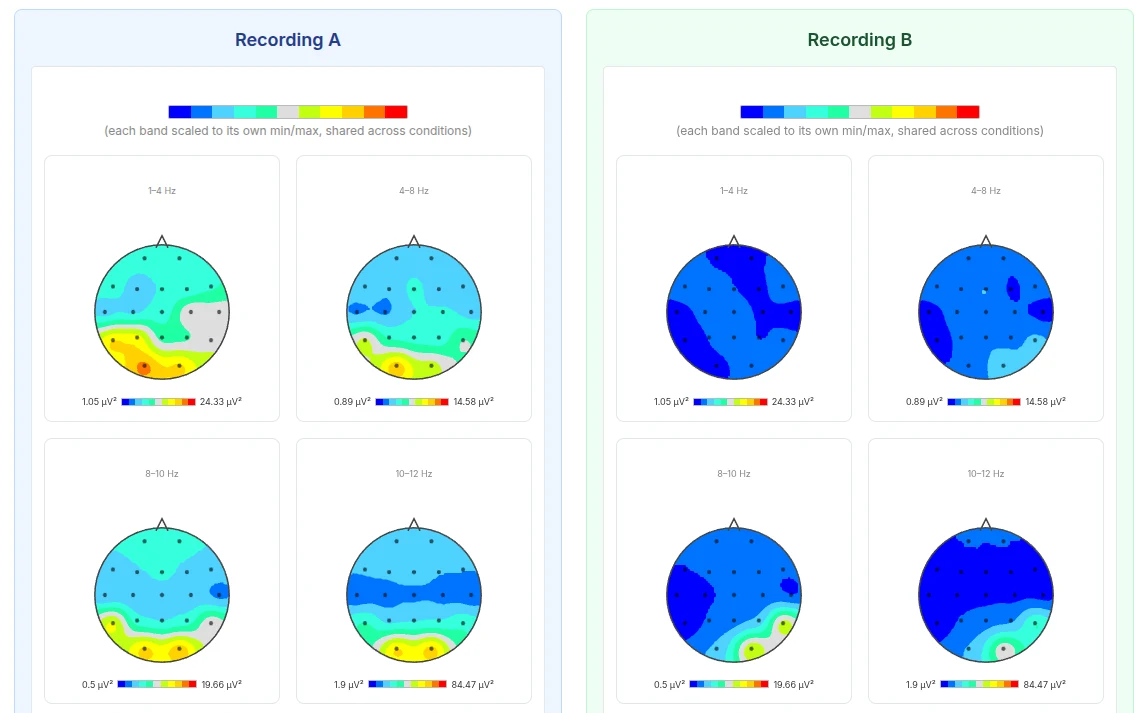
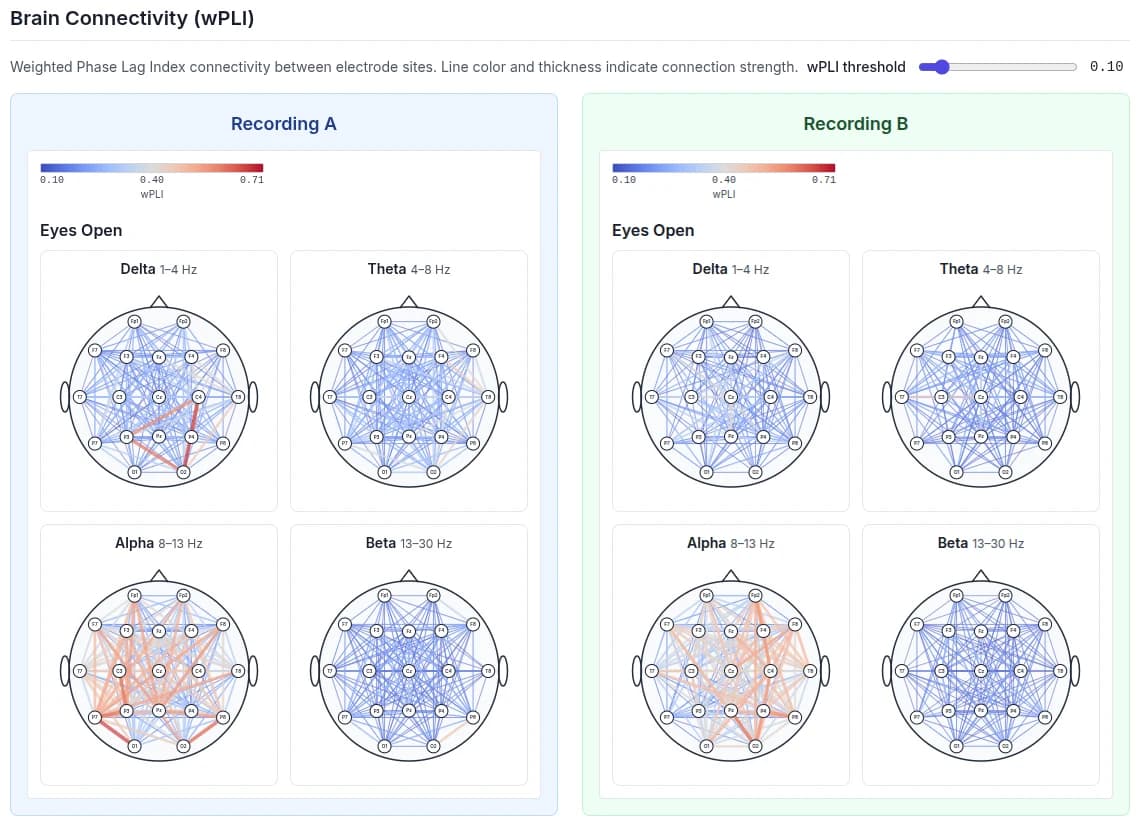
Compare two recordings on one shared colour scale: before and after training, eyes open and eyes closed, or session to session.
Track change
Two sessions, one scale
Recording A against Recording B: power, connectivity, asymmetry and peak alpha, side by side.
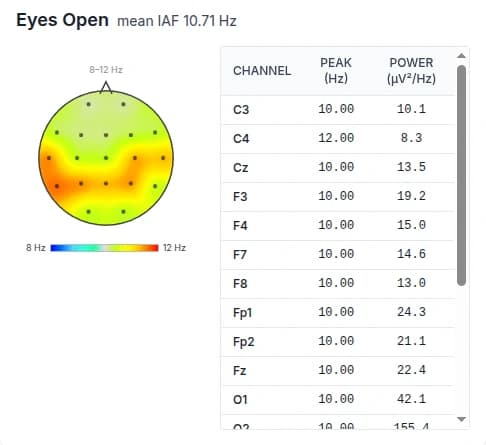
Mean individual alpha frequency
Recording A
IAF 10.05 Hz
Recording B
IAF 10.71 Hz
What's inside
Everything in the box
The kind of cleaning and quantitative EEG tooling usually locked inside desktop software or paid platforms, running free in your browser.
Signal de-noising pipeline
Channel QC and interpolation, zero-phase filtering, mains-hum removal, transient repair, ASR, and ICA with component classification or blink regression, plus adaptive epoch rejection. Pick a full, conservative, aggressive or rejection-only profile.
sLORETA source localization
Standardized current density for every band and condition, computed from the cleaned EEG. Explore it on MNI slices and as a 3D voxel cloud in a cortex mesh — or play a time lapse across the whole recording.
Brain maps
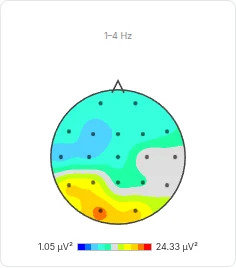
Topomaps of absolute and relative power across eight bands (delta to low gamma), for eyes open and eyes closed, plus a QC timeline that shows which windows were rejected.
Lempel-Ziv complexity (LZC)
Normalized signal complexity per channel, mapped across the scalp — a marker of how flexible and information-rich the brain's activity is.
Peak alpha frequency
Individual alpha frequency (IAF) for every channel, with its own topomap, alongside theta/beta and alpha/theta ratios.
Connectivity & asymmetry
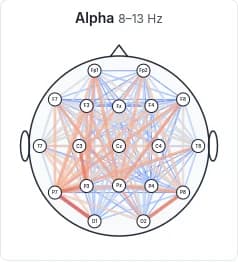
wPLI connectivity graphs with network metrics (efficiency, clustering, small-worldness), frontal alpha asymmetry and power asymmetry.
HRV from ECG
When the recording carries an ECG lead, Squiggly also computes heart rate variability: RMSSD, SDNN, pNN50, LF/HF and a tachogram.
Compare recordings
Put any two sessions side by side to see power, coherence and asymmetry changes — before and after training, or condition to condition.
100%
Free & open source (MIT)
ASR + ICA
Automatic de-noising
sLORETA
Source localization
8 bands
Brain maps, EO & EC

About Squiggly
Alex started developing Squiggly in November 2025, disappointed that no free, open-source EEG visualizer and analyzer was available to run on the cloud. There are good desktop-based EEG visualizers, both paid and free — but the need for an easy-to-use, barrier-free online tool that can be accessed anywhere prompted him to take action.
Keep EEG visualization & analysis open
Passionate about EEG and have skills? Consider contributing to keep EEG visualization and analysis open and free. In a world filled with secrets, transparency and openness matter.
Get involved